
Reports 2 min read
The Admin Portal provides a set of operational reports covering API performance, error rates, call volumes, payment activity, and consent statistics. All reports can be filtered by date range, sorted by any column, and exported to CSV for further analysis.
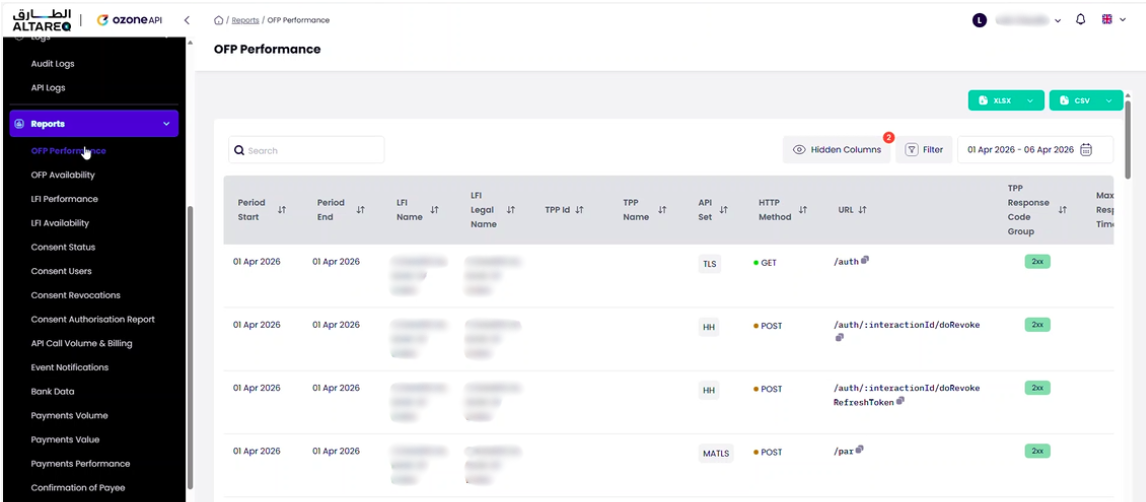
Response time metrics across all endpoints
The performance report aggregates API request data and provides response time metrics across all endpoints.
Each row includes:
| Column | Description |
|---|---|
| LFI Name | Your organisation name (always your LFI for your portal) |
| TPP Name | The TPP that made the request — blank for requests that do not involve a TPP (e.g. LFI-to-Hub calls) |
| Date | The date of the aggregated data |
| Endpoint | The API endpoint called (e.g. accounts, balances, beneficiaries, payments) |
| Response Code | The HTTP response status code |
| Max Response Time (ms) | The slowest response time for the endpoint in the period |
| Min Response Time (ms) | The fastest response time for the endpoint in the period |
| Average Response Time (ms) | The mean response time across all calls to the endpoint in the period |
| Number of Calls | Total number of requests to the endpoint in the period |
Response times represent the end-to-end request duration as observed by the API Hub — from receiving the inbound request to returning the response. This includes the LFI's response time.
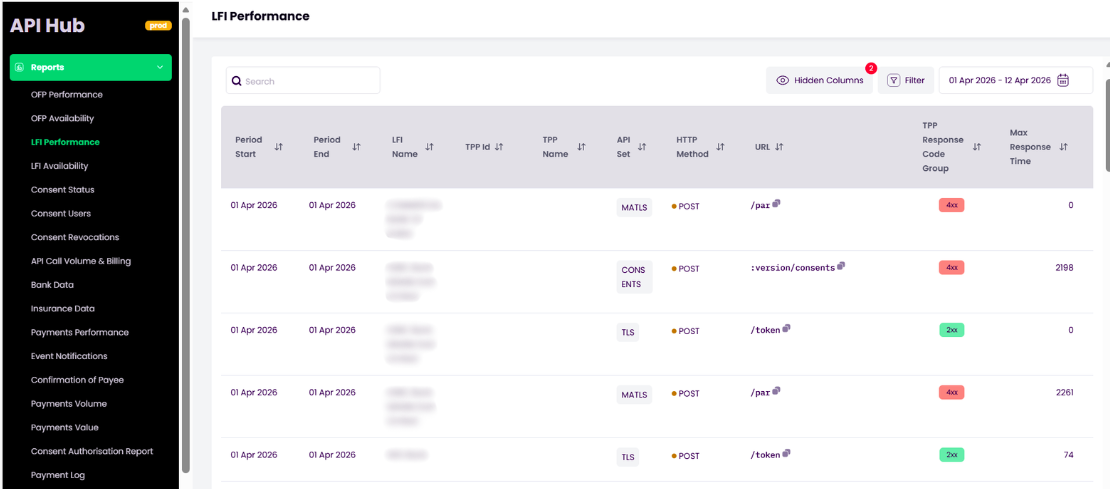
LFI performance
A separate LFI Performance report isolates your response times by removing API Hub processing latency. This report shows only the time between the API Hub forwarding the request to your Ozone Connect endpoint and receiving your response — giving you a clear view of your own system's performance.
Failed requests by endpoint, TPP, and error code
The error rates report provides a breakdown of failed requests by endpoint, TPP, and error code. Use this to identify:
- Endpoints with elevated error rates
- TPPs that are consistently sending malformed requests
- Trends in error volumes over time
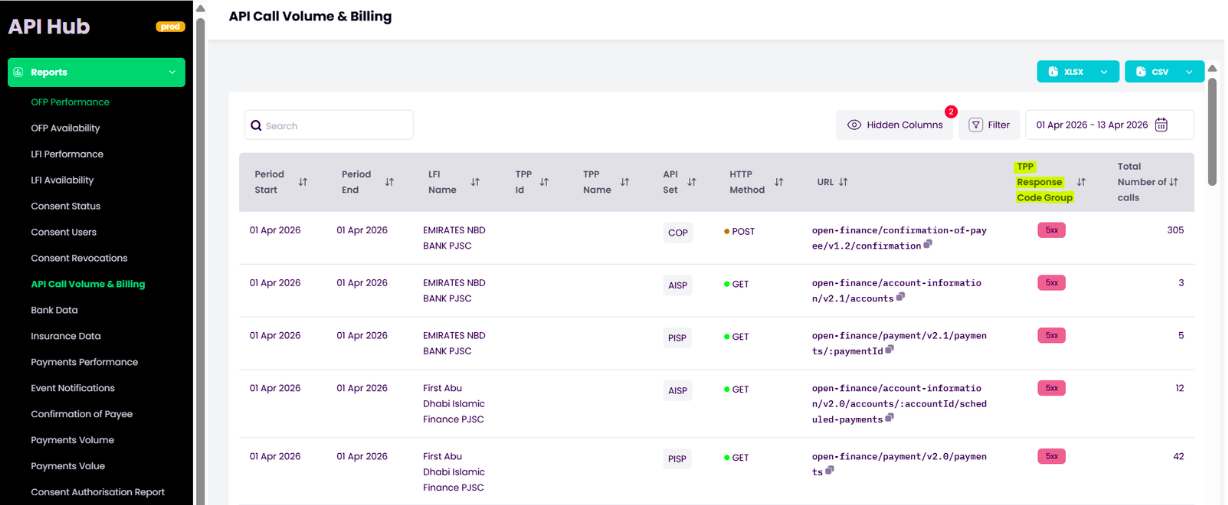
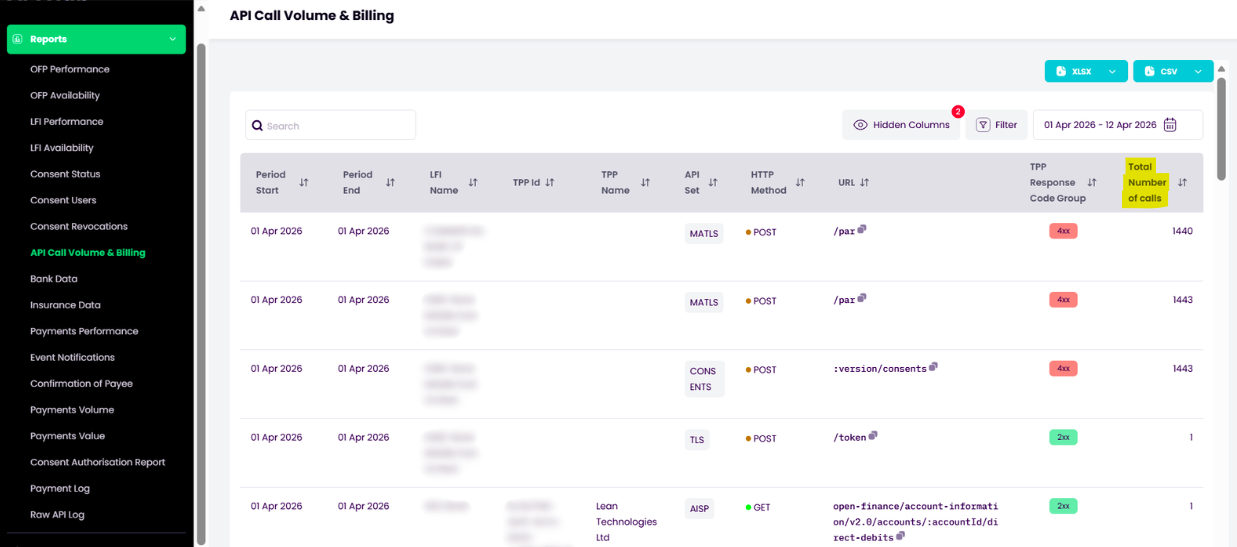
Total request counts by endpoint and TPP
The call volumes report shows the total number of API requests over a given period, broken down by endpoint and TPP. This is useful for understanding traffic patterns and capacity usage.
Payment values and volumes by type and TPP
Payment values
The payment values report shows the monetary value of payments processed through the API Hub, broken down by payment type, TPP, and time period.
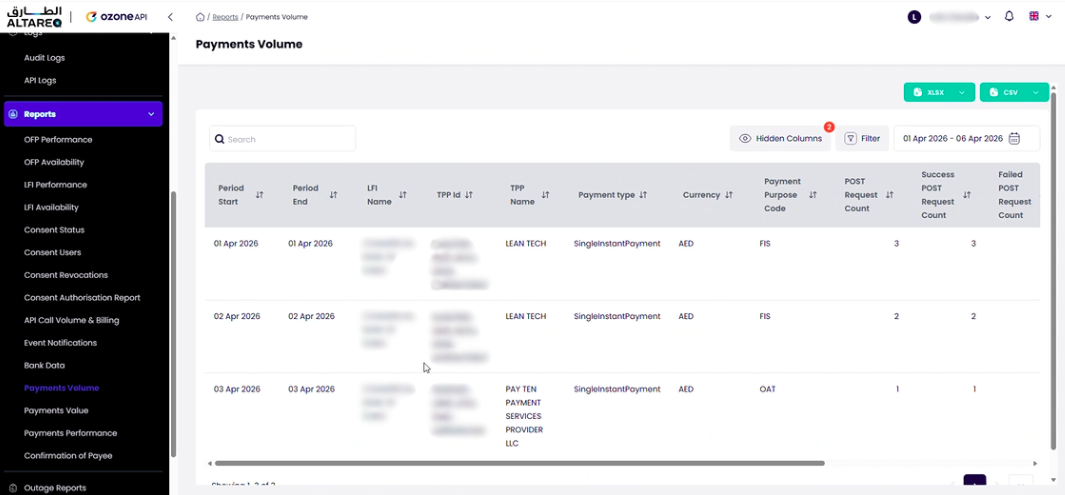
Payment volumes
The payment volumes report shows the number of payment transactions processed, broken down by payment type, TPP, status, and time period.
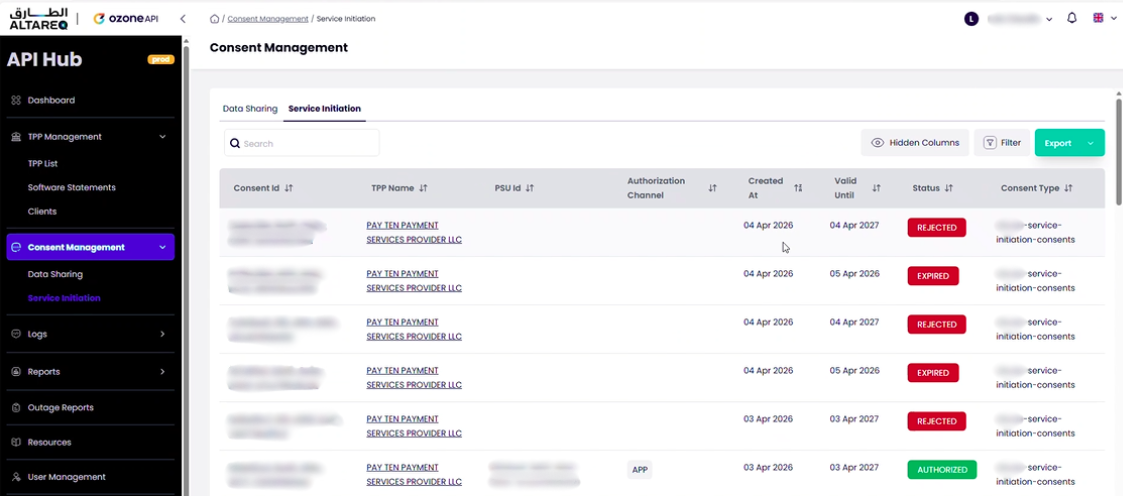
Consents created, authorised, expired, revoked, consumed
The consent statistics report provides an overview of consent activity — including consents created, authorised, expired, revoked, and consumed — broken down by consent type, TPP, and time period.
Common controls and CSV export
All reports share common controls:
- Date range filter — adjust the reporting period using the date picker
- Column sorting — click any column header to sort ascending or descending
- Column filters — filter rows by specific values (e.g. a specific TPP, endpoint, or response code)
- Export — download the current report view as a CSV file for offline analysis in Excel or other tools